The stochastic indicator is a momentum indicator developed by George C. Lane in the 1950s, which shows the position of the most recent closing price relative to the previous high-low range. The indicator measures momentum by comparing the closing price with the previous trading range over a specific period of time.
The stochastic indicator does not follow the price or volume of the underlying currency pair, but the speed and momentum of the price. This means that the stochastic indicator changes direction before the price itself and can thus be considered a leading indicator. The most important signals that Lane identified are the bullish and bearish divergences that form on the stochastic indicator, which can anticipate upcoming price reversals. However, as the stochastic indicator oscillates within a range, it can also be used to identify overbought and oversold price levels.
Although the stochastic indicator can be used in any financial market, it is especially popular among Forex traders and this article will focus on the Forex market.
The calculation of the stochastic indicator
The stochastic indicator is drawn with two lines on the chart; the indicator itself (%K) and a signal line (%D) which represents the 3-day simple moving average of %K. When these two lines cross, traders should look for an approaching trend change. A downward crossing of the %K-line through the signal line indicates that the current closing price is closer to the lowest low of the specified time period of the indicator than it has been in the previous three sessions. This is considered a bearish signal, while the opposite of this is considered bullish.
The stochastic indicator is calculated using the following formula:
%K = (Most Recent Closing Price - Lowest Low) / (Highest High - Lowest Low) × 100
%D = 3-day SMA of %K
Lowest Low = lowest low of the specified time period
Highest High = highest high of the specified time period
The default setting for the stochastic indicator is 14 periods and it can be applied to any timeframe; such as daily, weekly, or even intraday. The 14-period setting means that the %K line uses the most recent closing price and the highest high and lowest low over the last 14 periods. As said earlier, the standard setting for the %D line is a 3-period SMA of the %K line.
Let’s see how the stochastic indicator is calculated through an example. The following chart shows the EURCAD chart with the stochastic indicator applied to it using standard settings.

The indicator measures the last 14 periods to find the highest high (1.4800) and lowest low (1.4480) which are used in the calculations.
%K = [(1.4670 – 1.4480) / (1.4800 – 1.4480)] × 100
= (0.019 / 0.032) × 100 = 0.59 x 100 = 59
With the current closing price of 1.4670, the %K line has a value of 59 (as can be seen in the indicator window below the chart).
How to read the stochastic indicator
As a range-bound indicator, the stochastic oscillator can be used to identify overbought and oversold market conditions. A reading over 80 reflects overbought market conditions, and a reading below 20 reflects oversold market conditions. The stochastic indicator itself can range only from 0 to 100, no matter how fast the price of the underlying currency pair changes. In a standard 14-period setting, a reading above 80 indicates that the pair has been trading near the top of its trading range over the last 14 periods, while a reading below 20 indicates that the pair has been trading near the low of its trading range over the last 14 periods.
It is important to note that oversold readings are not necessarily bullish, just like overbought readings are not necessarily bearish. During a sustained uptrend or downtrend, the stochastic indicator can remain in the oversold or overbought area for a long period of time. It is, therefore, advised to always trade in the direction of the trend and wait for occasional oversold readings during uptrends and overbought readings during downtrends.
How to use the stochastic indicator
The stochastic indicator is popularly used to trade oversold and overbought conditions, as well as bullish and bearish divergences. The following example shows how to trade oversold conditions during an established uptrend, making trades in the direction of the trend.

Points (1), (2), and (3) show oversold market conditions while the EURCAD pair is in an overall uptrend. Those oversold conditions are created with each correction of the pair, signaling that the uptrend is likely to continue. A possible trading strategy would be to enter when the %K line crosses the signal line from below, with a Stop Loss level just below the previous swing low. It is also important to wait for additional confirmation signals; such as candlestick patterns, as momentum indicators are known to throw false signals from time to time.
Divergences
Divergences are used to determine tops and bottoms of trends, and to decide on when to enter and exit a position. In this regard, divergences are a leading indicator of future price action.
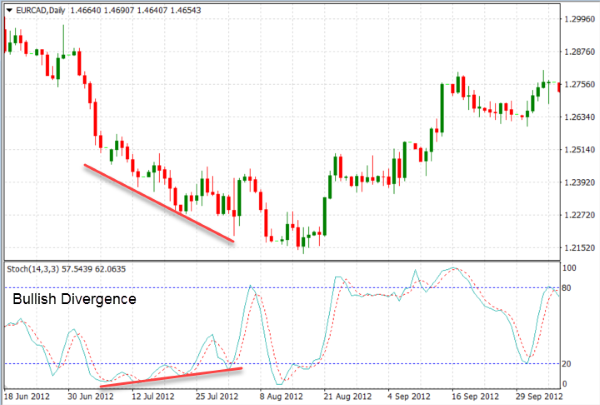
Normally, both the price and the technical indicator should move in the same direction. A divergence in forex occurs when the price and the indicator fail to simultaneously make higher highs or lower lows, i.e. they are “diverging” one from another.

The following example shows a bullish divergence on the EURCAD daily chart. While the price made consecutive lower lows, the indicator didn’t follow the price and, instead, made higher highs. The indicator and price “diverged” one from another. As a result, the price changed its previous downtrend to start a new uptrend.

Summary
The stochastic indicator is widely used in the Forex community. It consists of two lines: the indicator line %K, and the signal or trigger line %D. The stochastic indicator can be used to identify oversold and overbought conditions, as well as to spot divergences between the price and the indicator.
A reading above 80 is usually considered as overbought, while a reading below 20 is considered oversold. However, the price can remain in overbought and oversold conditions for a long period of time, especially during strong up- and downtrends.
A divergence occurs when the price “diverges” from the indicator, i.e. the price makes lower lows while the indicator makes higher lows, or the price makes higher highs while the indicator makes lower highs.
As with any momentum indicator, traders should wait for additional confirmation signals to enter a trade, as these types of indicators can occasionally give false signals.
